
Rosa Fry
Architectural Historian & Preservation Planner
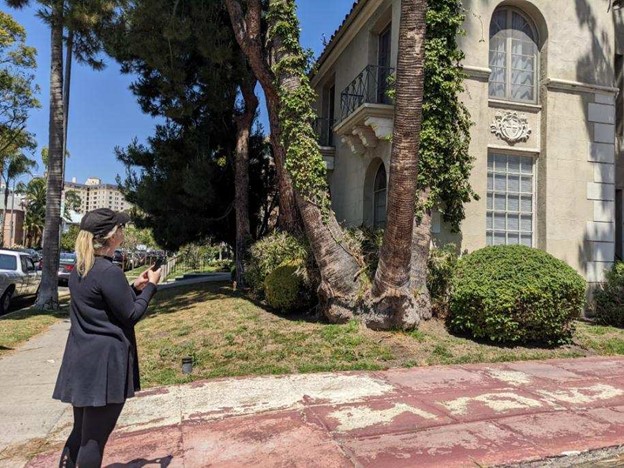
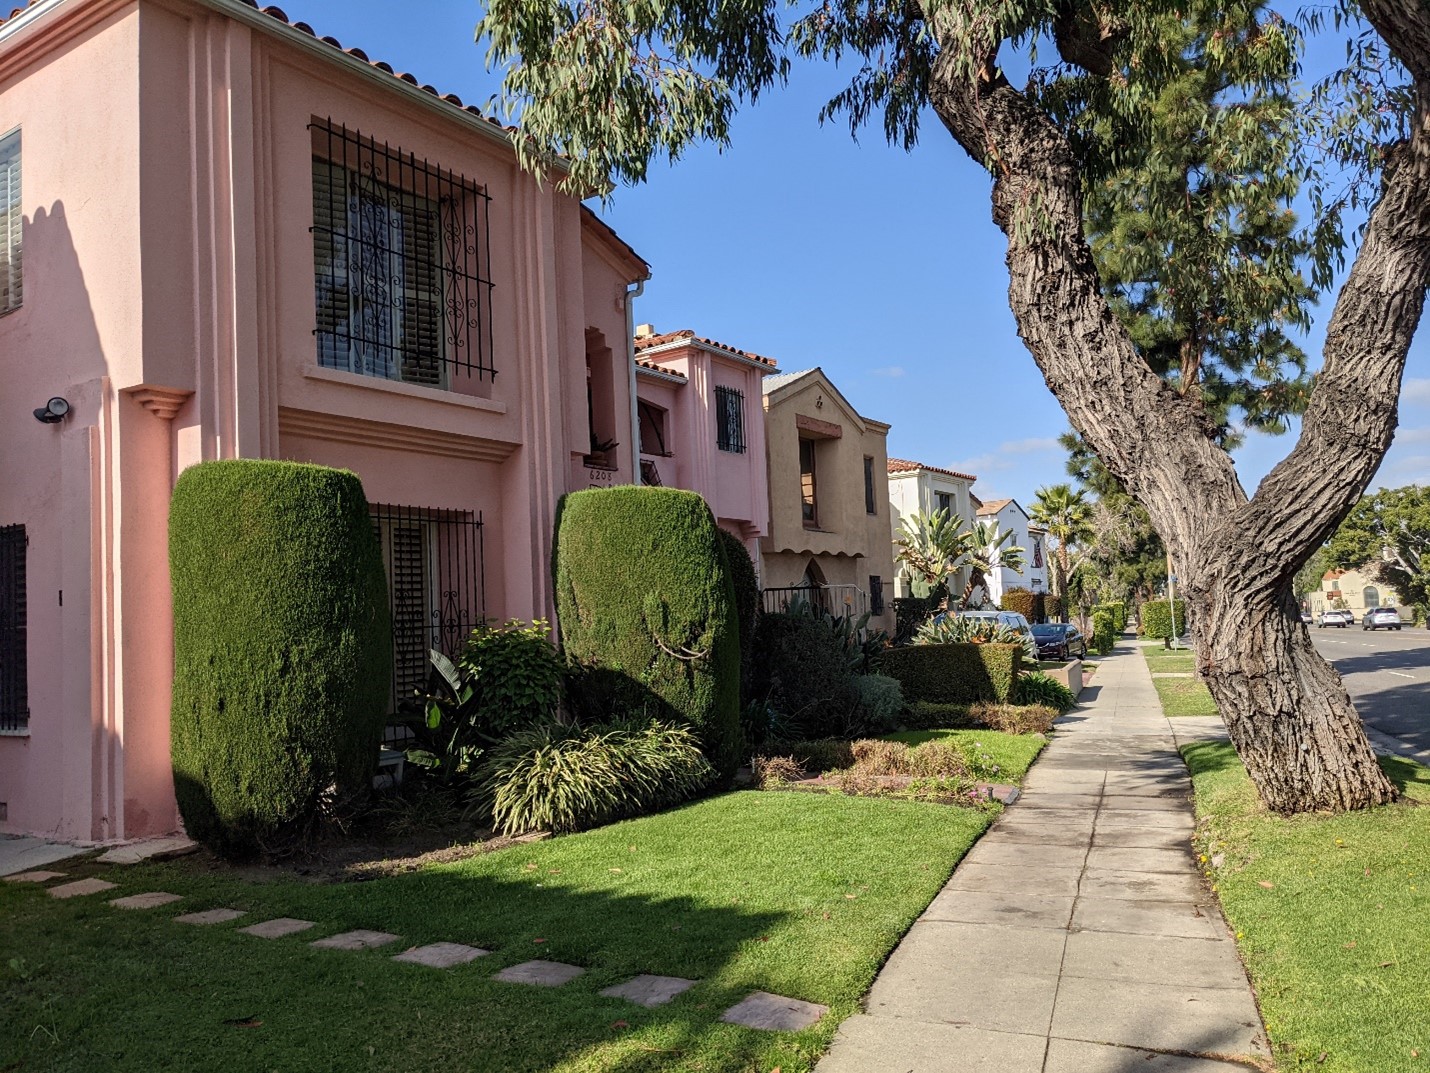 A lovely day for a survey in the Carthay Neighborhoods Historic District.
Historic resources surveys are an essential component of preservation planning and a valuable tool for communities looking to understand the historic significance of local buildings. In order to provide the highest quality surveys, the planning team at Architectural Resources Group is always seeking out new technology to streamline data collection in the field and analysis in the office. Survey documentation apps meant specifically for historic preservation purposes are rare, however, and waiting for a one-size-fits all tool could take a short eternity, so we decided to get creative and build our own.
The Need for New Technology
Following the successful completion of SurveyLA, the ambitious citywide historic resources survey of Los Angeles, ARG has worked to further hone our survey capabilities for use in other cities and neighborhoods. SurveyLA utilized the city’s Field Guide Survey System (FiGGS), a custom mobile application designed for tablet PCs which allowed surveyors in the field to identify and evaluate resources. After SurveyLA, ARG began investigating new survey documentation technologies for use on future citywide historic resources surveys, smaller historic district surveys, and National Register District nominations.
Historic resources surveys provide invaluable information for city and county planning departments, and the information gathered about potential historic resources can inform long-range planning decisions and bolster preservation policy goals. However, many surveys, especially those that are city-wide, can be massive undertakings with thousands of potential resources to record. Thankfully, documentation technology has evolved from analog pen and paper methods to fully digital platforms available right on our phones. As we planned our survey strategy, we sought a digital application to build out to our own specifications.
Our requirements for a new survey platform included:
- The ability to collect data in the field directly on our phones. While we have used tablets in the past, they can be unwieldy for large-scale surveys. Our 2020 citywide survey of San Marino, California required several months of fieldwork, and we certainly appreciated using our lightweight devices.
- The ability to collect data offline. Although cell phone service is usually consistent in large cities, it is less predictable in more remote areas, and in both cases access to wi-fi networks is sporadic at best. As a result, we needed the platform to work well offline, and to reliably back up data in the cloud.
- Geo-locating capabilities and GIS compatibility. With geo-locating capabilities, we are able to autofill the address of a potential resource merely by standing in front of the building. GIS (geographic information system) compatibility can take that shortcut to the next level, allowing us to pre-plot every potential resource within the survey boundaries before we ever set foot in the district.
After a comprehensive study of the available survey platforms, ARG identified Fulcrum as the tool best suited to our mobile documentation needs. A cloud-based application used to create digital forms and documents, Fulcrum is utilized by a variety of industries including construction, oil and gas, education, and engineering. Although the app was not designed specifically for historic resource surveys, the platform is highly customizable.
We begin the process of designing a new survey form in the office. Our aim is to create a series of prompts that will allow a field surveyor to thoroughly describe a building as efficiently as possible. By creating and adapting different fields within the app we are able to build a form to best capture the information needed for a certain type of survey project. Citywide historic resources inventories, historic district surveys, and National Register District nominations collect varying amounts of information, and our digital survey forms reflect this. For example, we always need the ability to identify and indicate which properties contribute to a district and which do not. That “evaluation” field is present on every survey form we create. However, for more intensive surveys we collect detailed information about particularly significant structures. For these surveys, we might include a specific field with a drop-down list of architectural features in order to be able to quickly select the appropriate details for each building.
Once the survey form is complete, we can begin to collect data. Before heading off into the field it is often valuable to download all available material from GIS. Mapping and information systems experts on staff at ARG help with this essential step! In addition to pre-plotting records, GIS data can provide a wealth of information including geo-location figures, assessor parcels numbers (APNs), and building construction dates.
 Fully prepared for our fieldwork we are ready to leave the office!
Out and About
Once in the field, our digital survey form is used in essentially the same way as a paper form. We capture the necessary details of every property in the survey area, but we also have special fields to create important notes and photographs. After our fieldwork is finished, we return to the office to review and correct the data, complete property evaluations, and make any needed adjustments to the forms we’ve created.
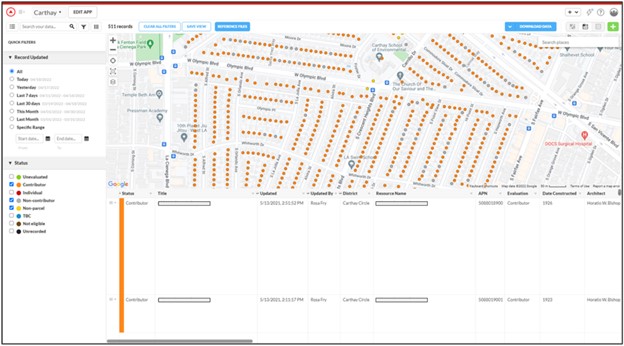 On this map, each dot (known as a centroid) represents a building that we have evaluated.
The orange centroids are properties that contribute to the district, while the gray are non-contributors.
After every property has been recorded and reviewed, the information gathered can be presented to clients in a variety of ways. We can “print” (PDF or hard copy) an individual page for each property and generate an Excel spreadsheet of all the survey data for easy sorting and importing into GIS; this makes it easy to analyze properties as a group, and to create maps. When clients require a specific record format we are able to create layouts in-house or, for more complex printed records such as California’s DPR 523 forms, we turn to coding experts.
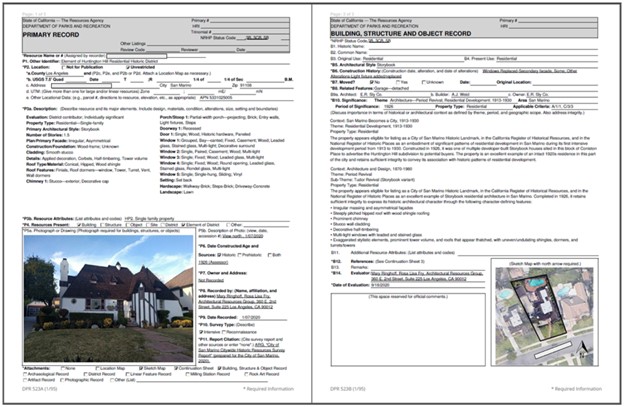 An example of the final product: a DPR form for an individually significant resource.
Since piloting our custom-built mobile documentation app in 2019, ARG has completed seven major surveys and recorded over 5,000 properties. The app has streamlined our fieldwork and data collection, as we continue to hone our efficient and effective survey methodology with each new project we undertake.